Top 3 Dashboard Design to Get Inspiration from
Yellow Slice
Did you know that dashboards were originally created to protect vehicles? It's true! Back in the day, they were primarily used in the automotive industry. Evolving from mere mudguards, they later displayed vital information like speed, fuel levels, and oil pressure, which are crucial for drivers.Dashboards are also the information center for businesses.Need to keep employee records? Get a dashboard.Who is doing what? Build an activity dashboard.Late for a meeting, need the current stats of the project? Take a quick glimpse of the client dashboard.Given a choice between a 30-page report and a single place with multiple interactive features and key elements of your latest project, what would you choose to work with? The answer is obvious!As a UI/UX agency, Yellow Slice always comes up with interactive, appealing and engaging dashboard designs. Our approach emphasizes prioritizing data points, ensuring an optimized interface for every user.
What Types of Dashboards Can You Create?
If you have a room full of 10 UI/UX designers and assign a task to build dashboards, do you know how many dashboards can be created?If your answer is 10, then let us remind you about the ink pad and the dropper that allows you to choose ANY COLOR you want. Similarly, there are thousands of icons and ways to arrange the elements. So, the possibilities are endless.Dashboards are not one-size-fits-all components. Every business is unique, and so are their needs. Here, we are going to focus on the major types of dashboard design concepts that are commonly used as a foundation for dashboards.
Strategic Dashboards
Strategic dashboards are designed to align with an organization's long-term goals and objectives. They provide an overarching view of critical metrics that directly impact the company's strategic direction.These dashboards might include high-level KPIs such as:
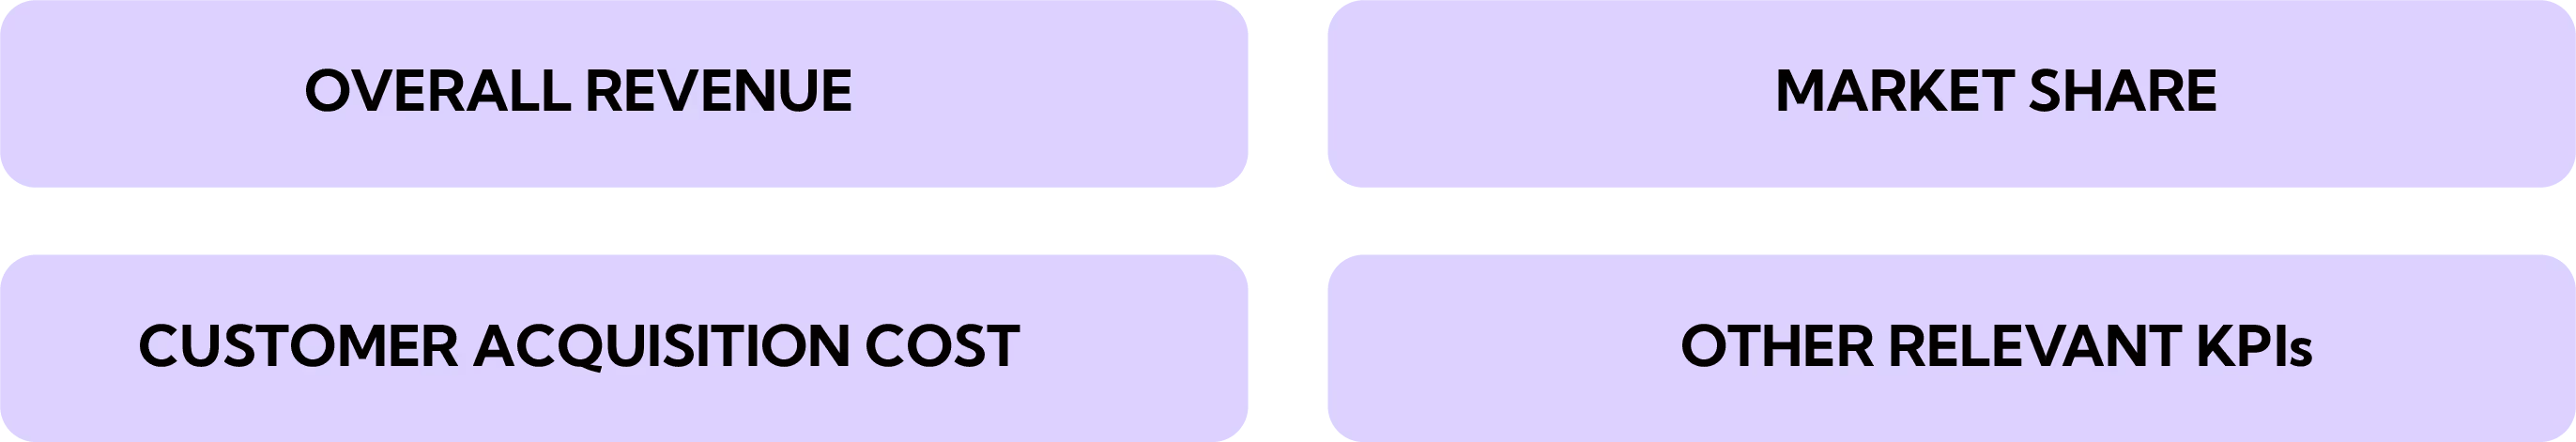
They help top-level executives and stakeholders in making informed decisions about the future direction of the business.
Operational Dashboards
Operational dashboards are focused on real-time or near-real-time data, offering insights into day-to-day activities and processes within an organization.They serve the following purposes:

They assist managers and frontline workers in identifying issues promptly and optimizing operational workflows.
Tactical Dashboards
Tactical dashboards serve as a bridge between strategic and operational dashboards, catering to the needs of mid-level management and specific teams or departments. They provide detailed insights into:
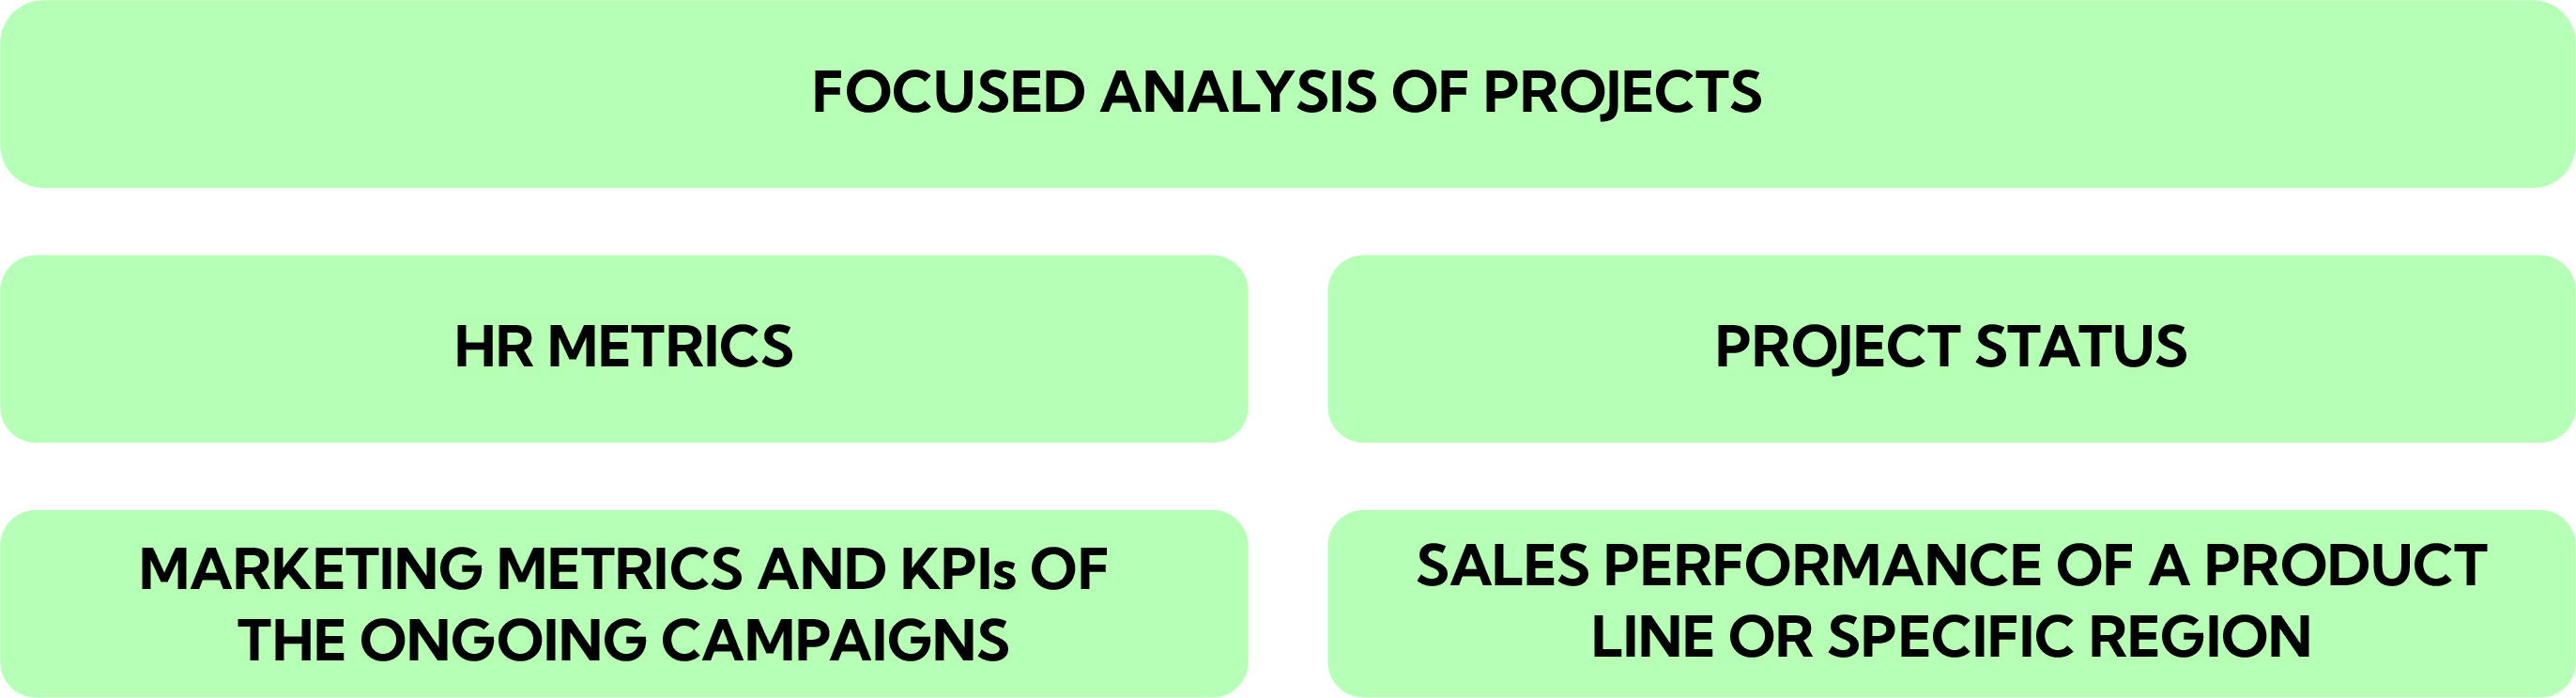
Tactical dashboards empower managers to monitor progress, assess performance against set goals, and make informed decisions to drive improvements.

Get Inspired With These Dashboard Designs
Someone might have submitted the file with an error; thus, the UNDO function would have been invented. Learning from others experiences and examples is one of the best ways to transform your work into success. And when it comes to designing dashboards, it is always fruitful to have a look at some examples and take inspiration.Lets check out how Yellow Slice gave a makeover to some of the dashboards and made them lively:
1. My Loft
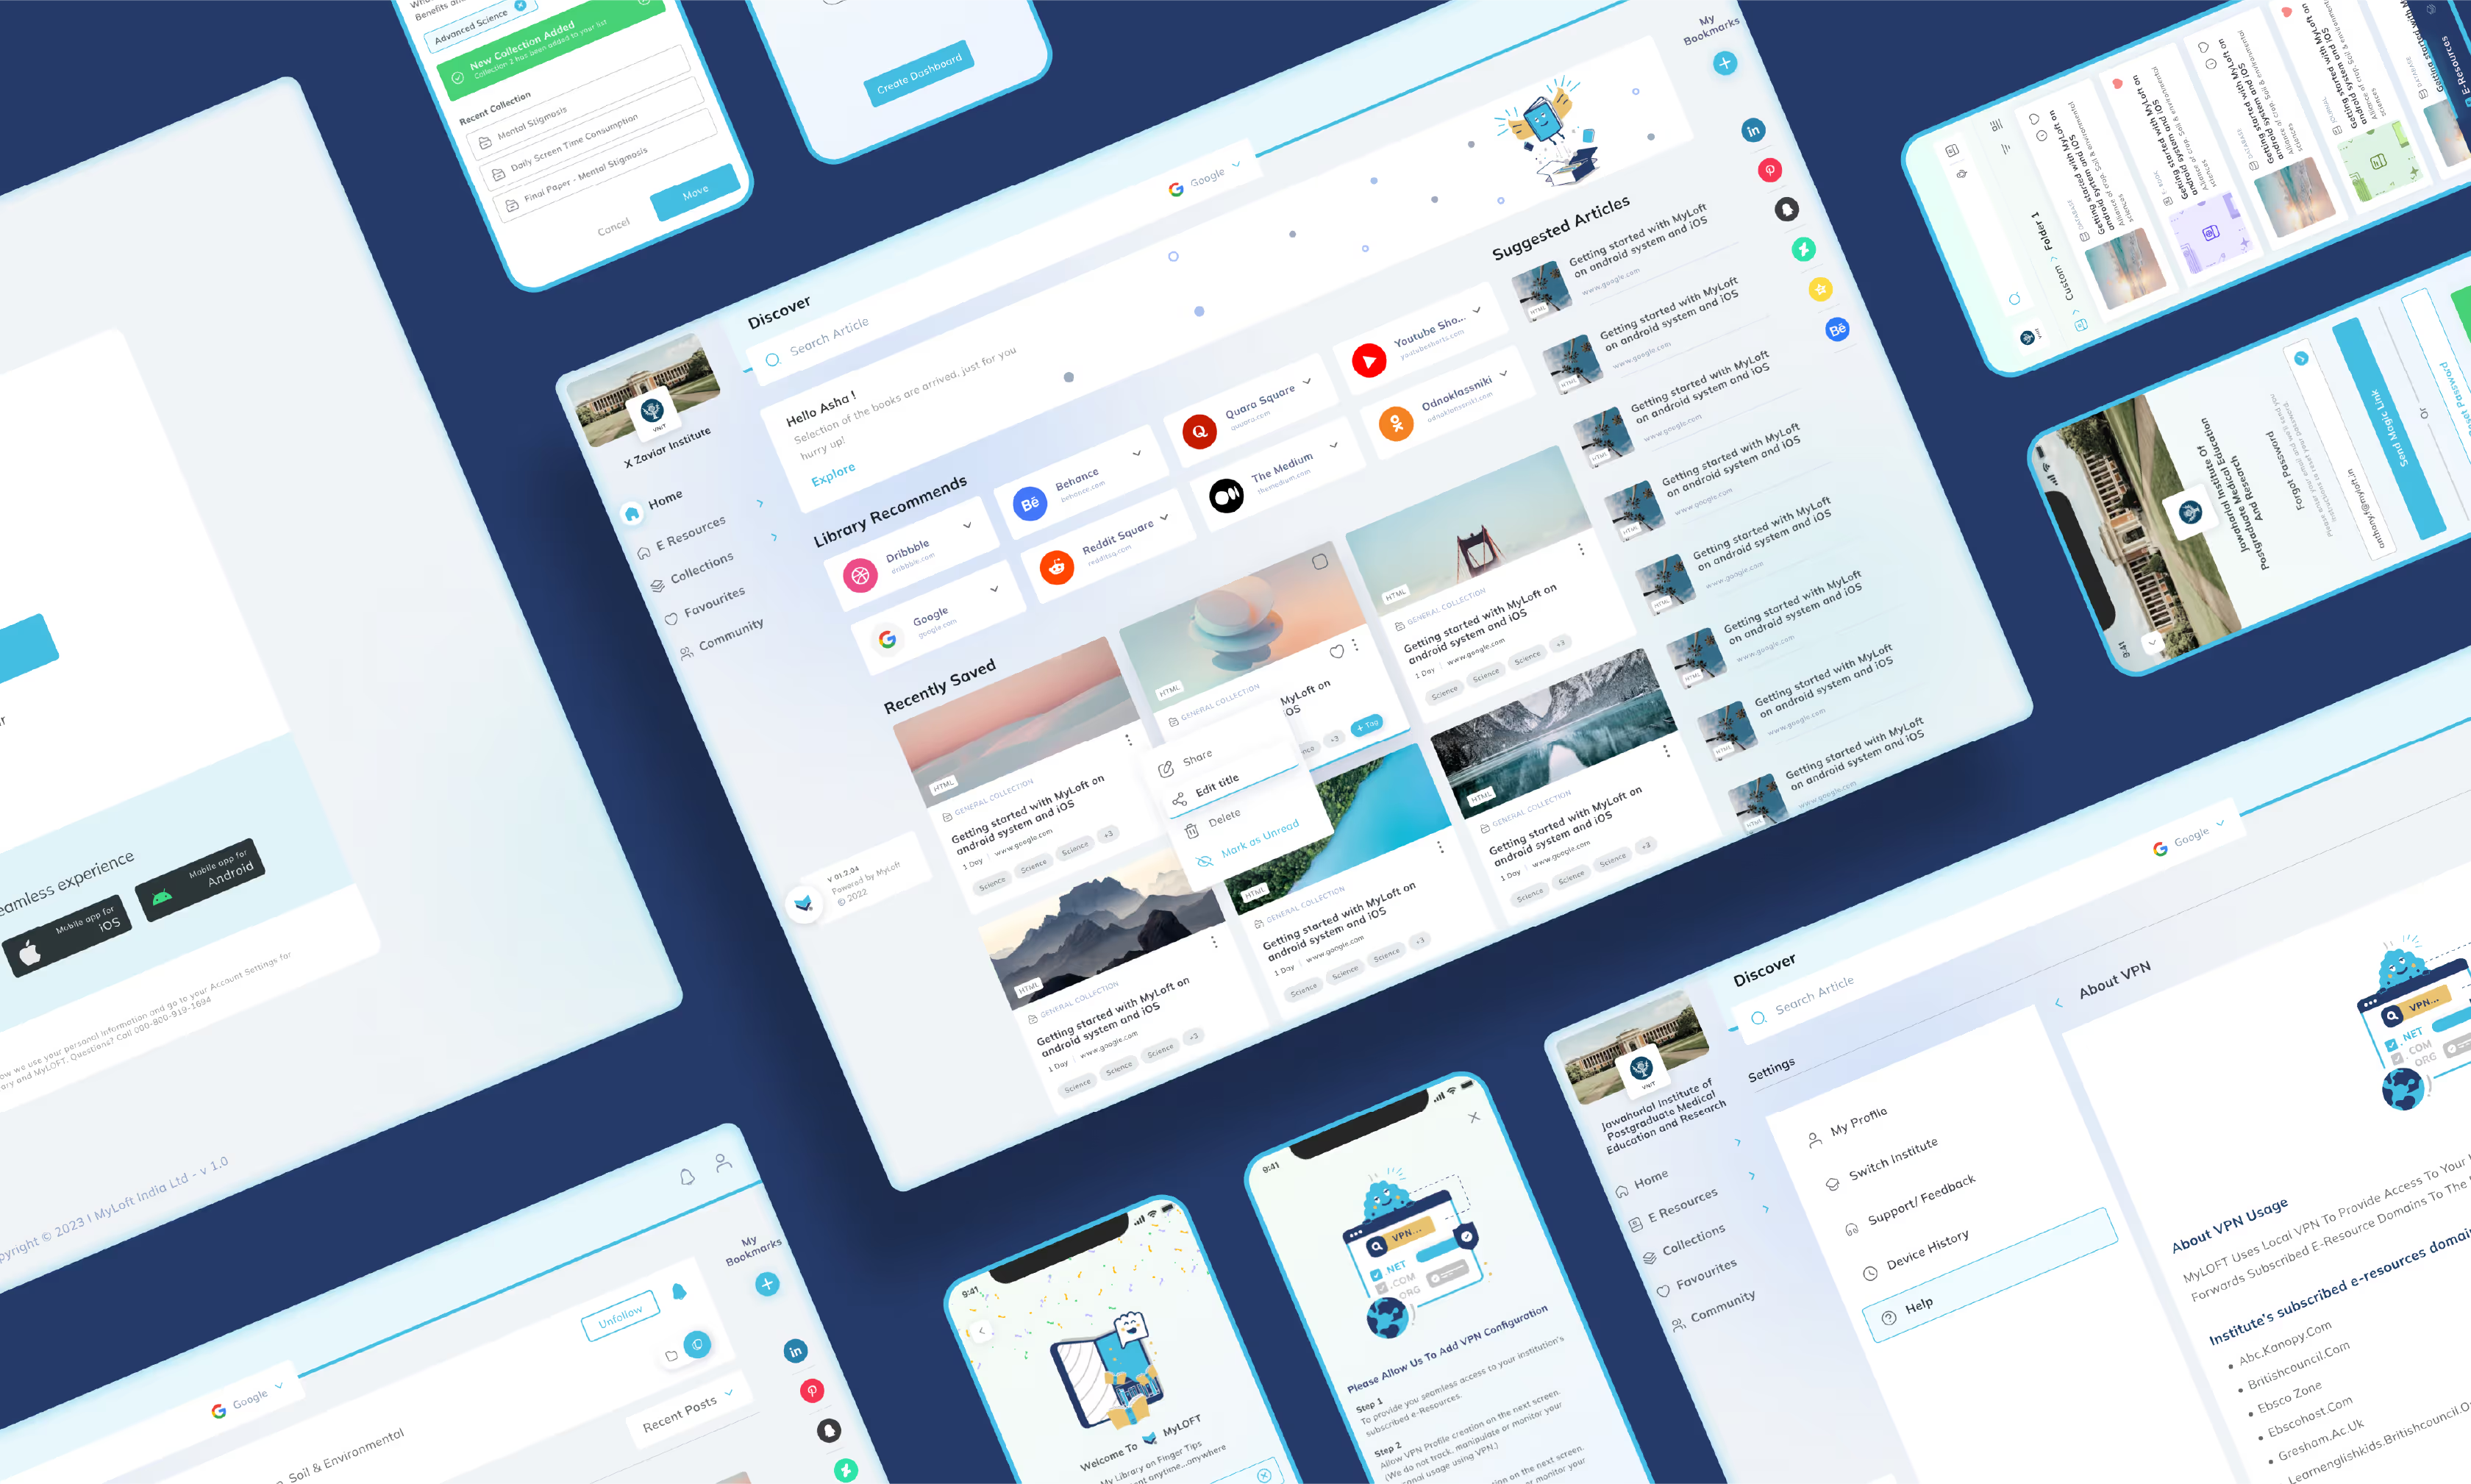
Even the worlds largest library becomes a smaller place for a dedicated student who wants to learn, learn, and learn. The world is filled with ample study material, either in the form of hard copies, books, or the Internet.My Loft is a centralized library system that brings thousands of books, journals, research papers, review reports, and more to students, academicians, and educators at their fingertips.
Problem Statement
My Loft wanted to revamp their web plugin and mobile application to enhance the user experience. They wanted to grant users access to log in, view, and arrange the resources available both online and offline using the same features found on their web portal. The features should be available on the mobile app and plugin.
Key Takeaways from My Lofts Dashboard
Lets check out what our designers did to meet the goals of My Loft.
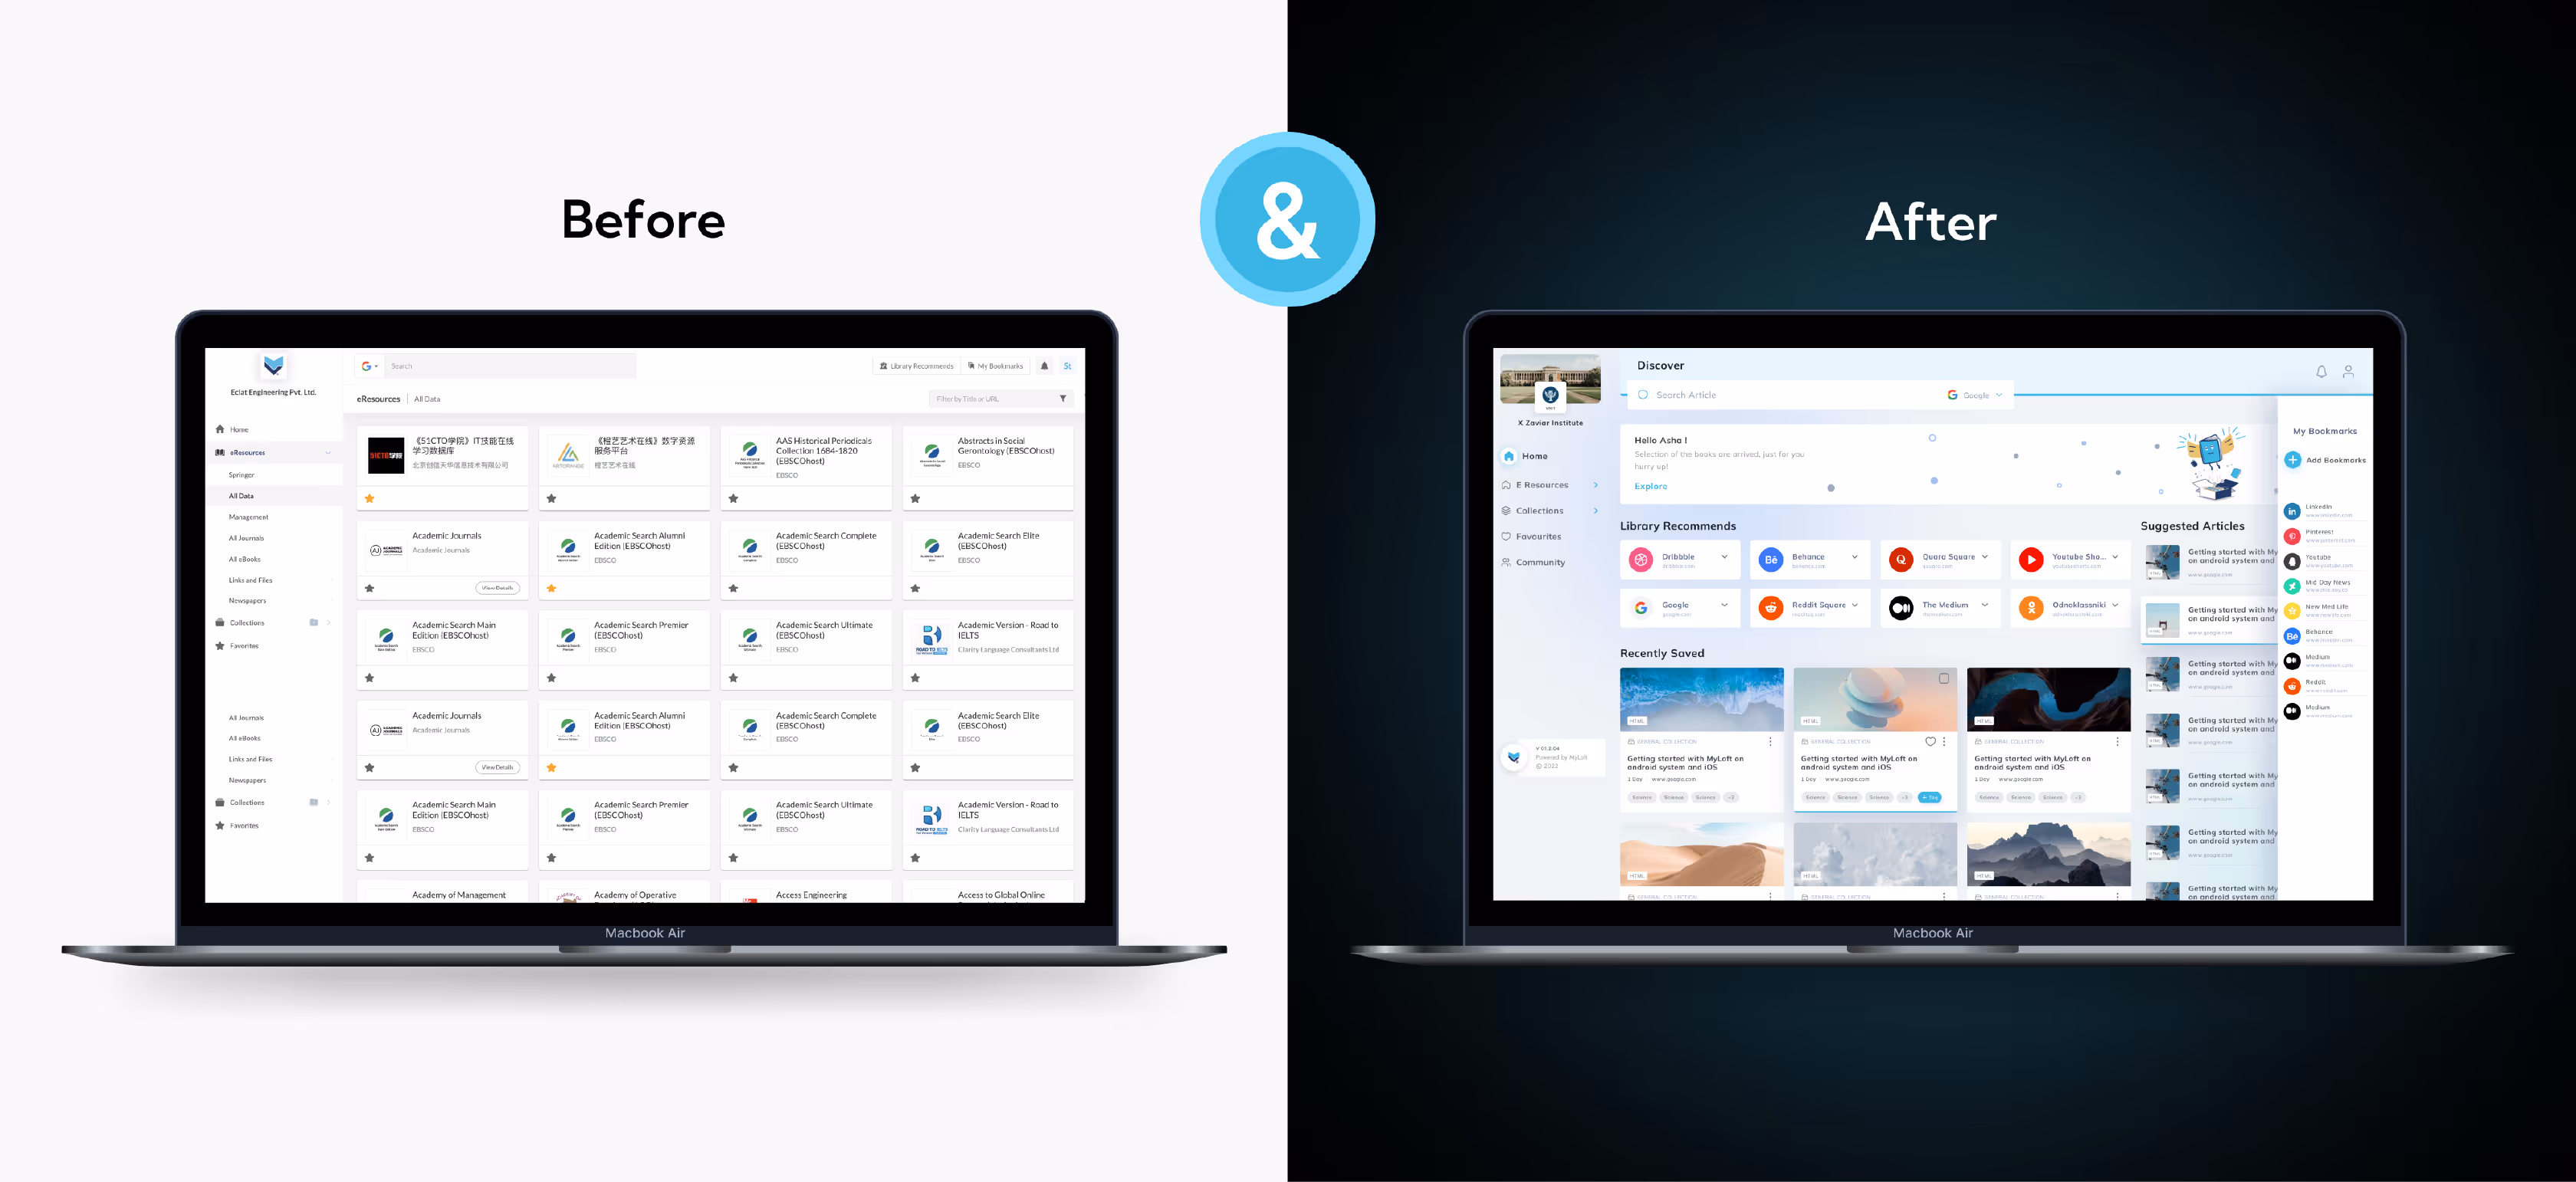
If we look at the old dashboard design, the dashboard consists of the books in your collection and an option to mark your favorite book.Even though the dashboard has certain functionalities, the color scheme or the features do not appear to be user-friendly and are likely not to attract the attention of the users.
Yellow Slice Touch:
- To make the dashboard more user-inclusive, we have given specific profiling to users. This grasped the attention of users and made them feel more connected.
- Adding a bright palette of colors brought out the essence of the application.
- We added features like a bookmark section, suggested articles, recommendations of libraries students could access, and more elements.
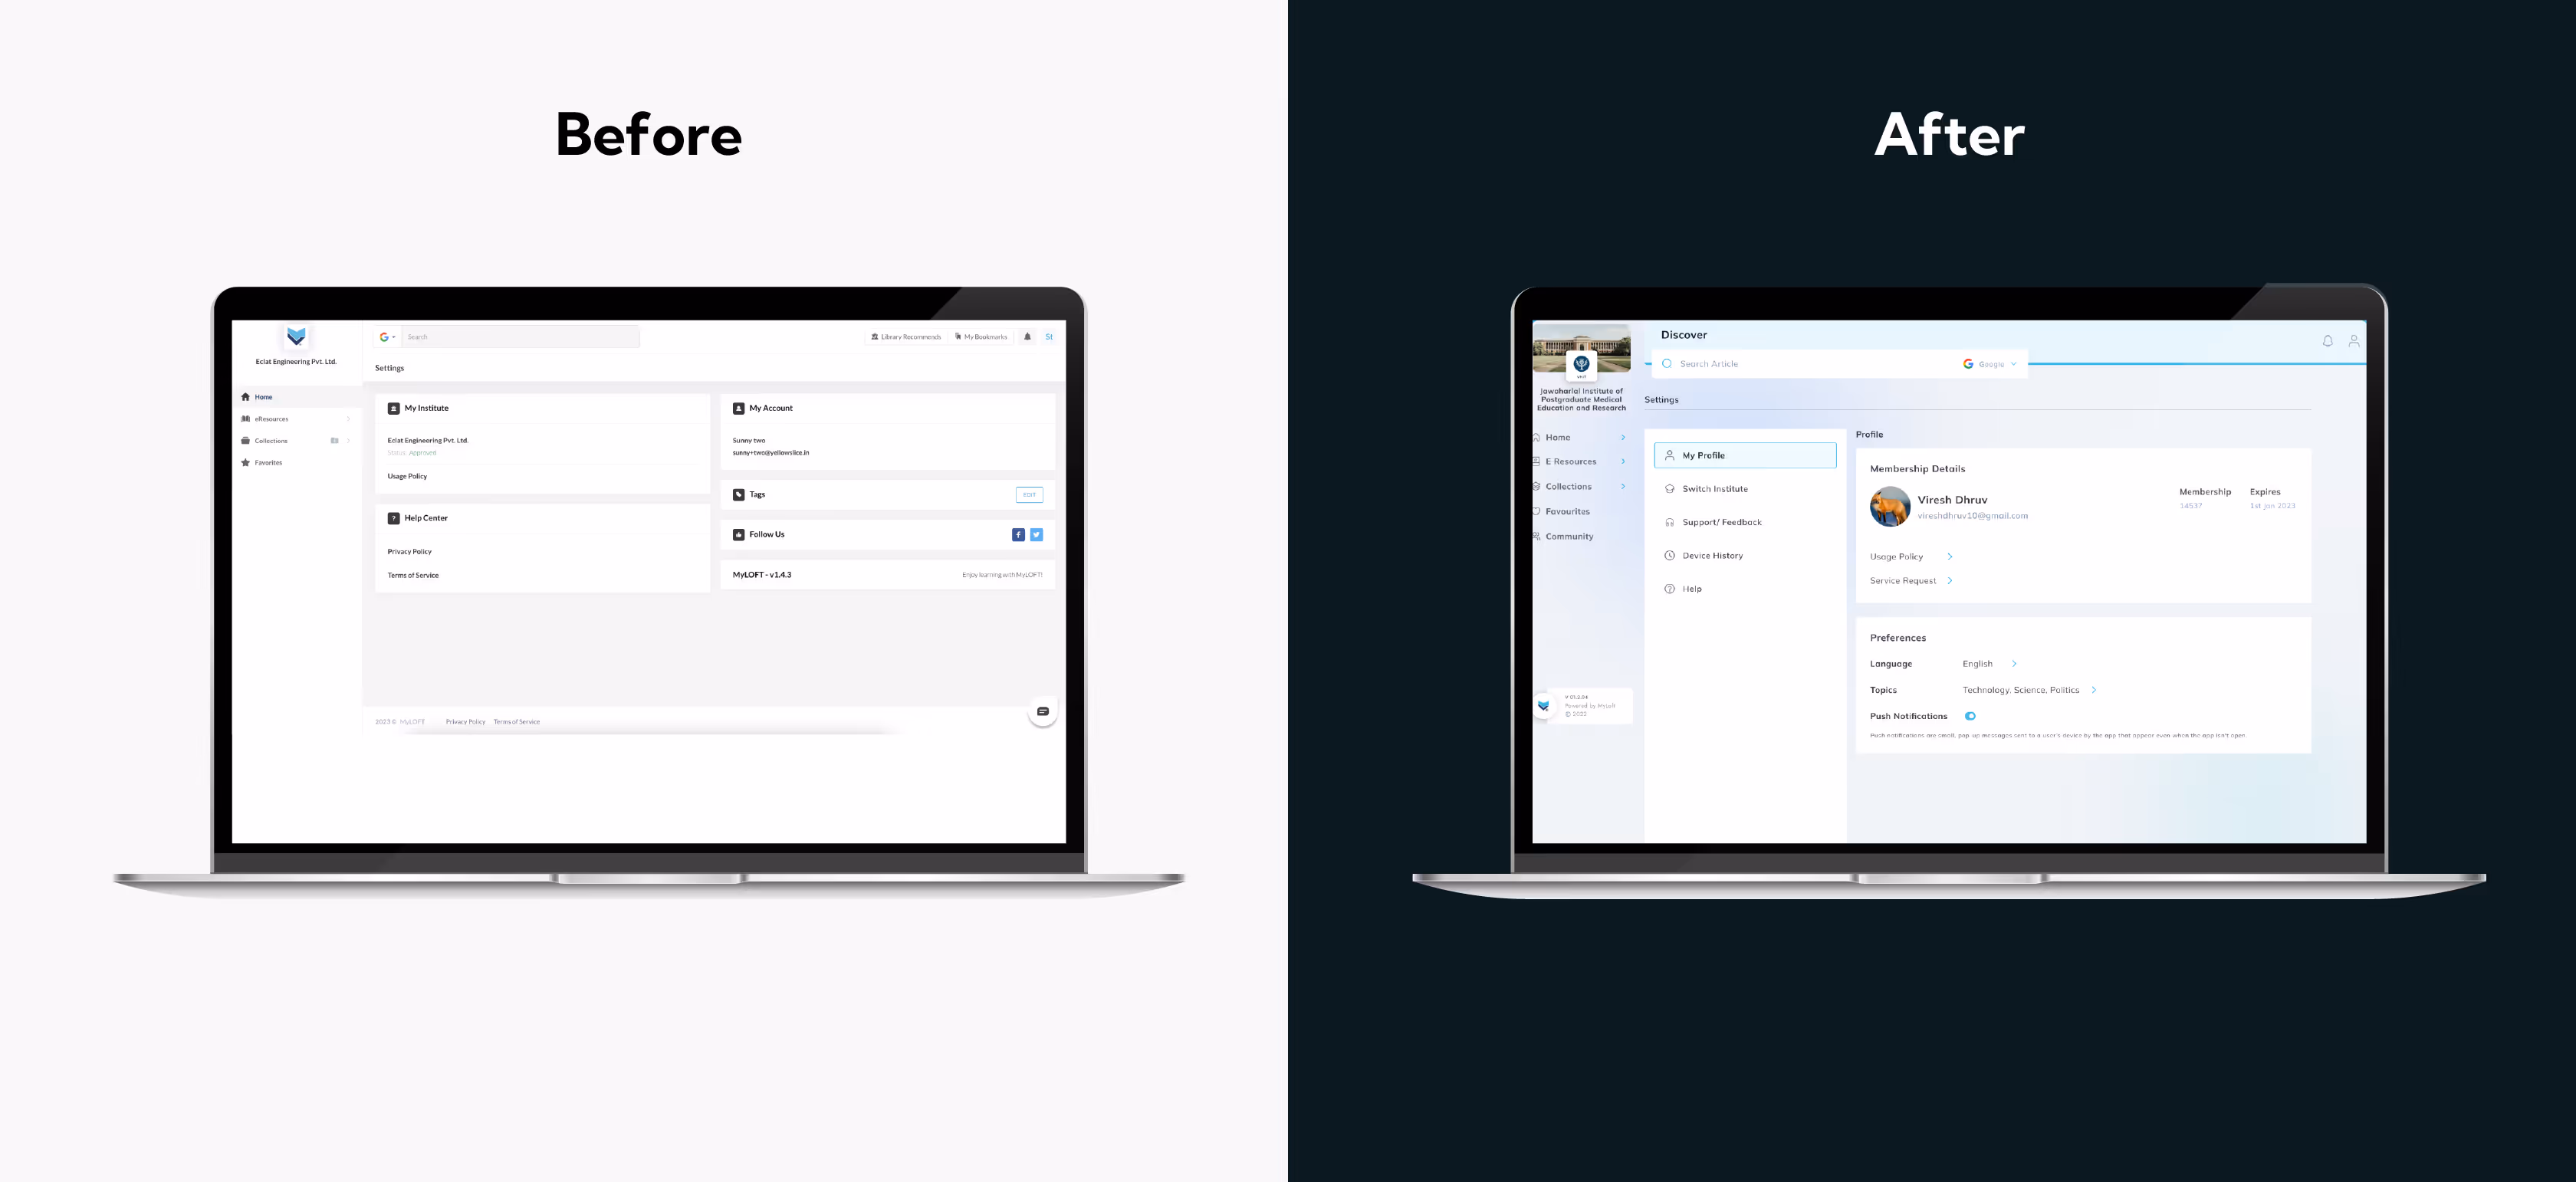
The older version of the application had a simple settings section with limited features.
Yellow Slice Touch:
- To give it a more welcoming look, firstly, our designers introduced the decided-upon color palette.
- Added the user profile with a display picture, membership number, term of membership, and some user preferences, such as languages, interested subjects, and more.
- To make the design more accessible, we added a column over to the left side with additional functionalities like home, community, favorites, collections, and resources icons.
- The users can easily connect with help and support, check their device history, or change their institutions.
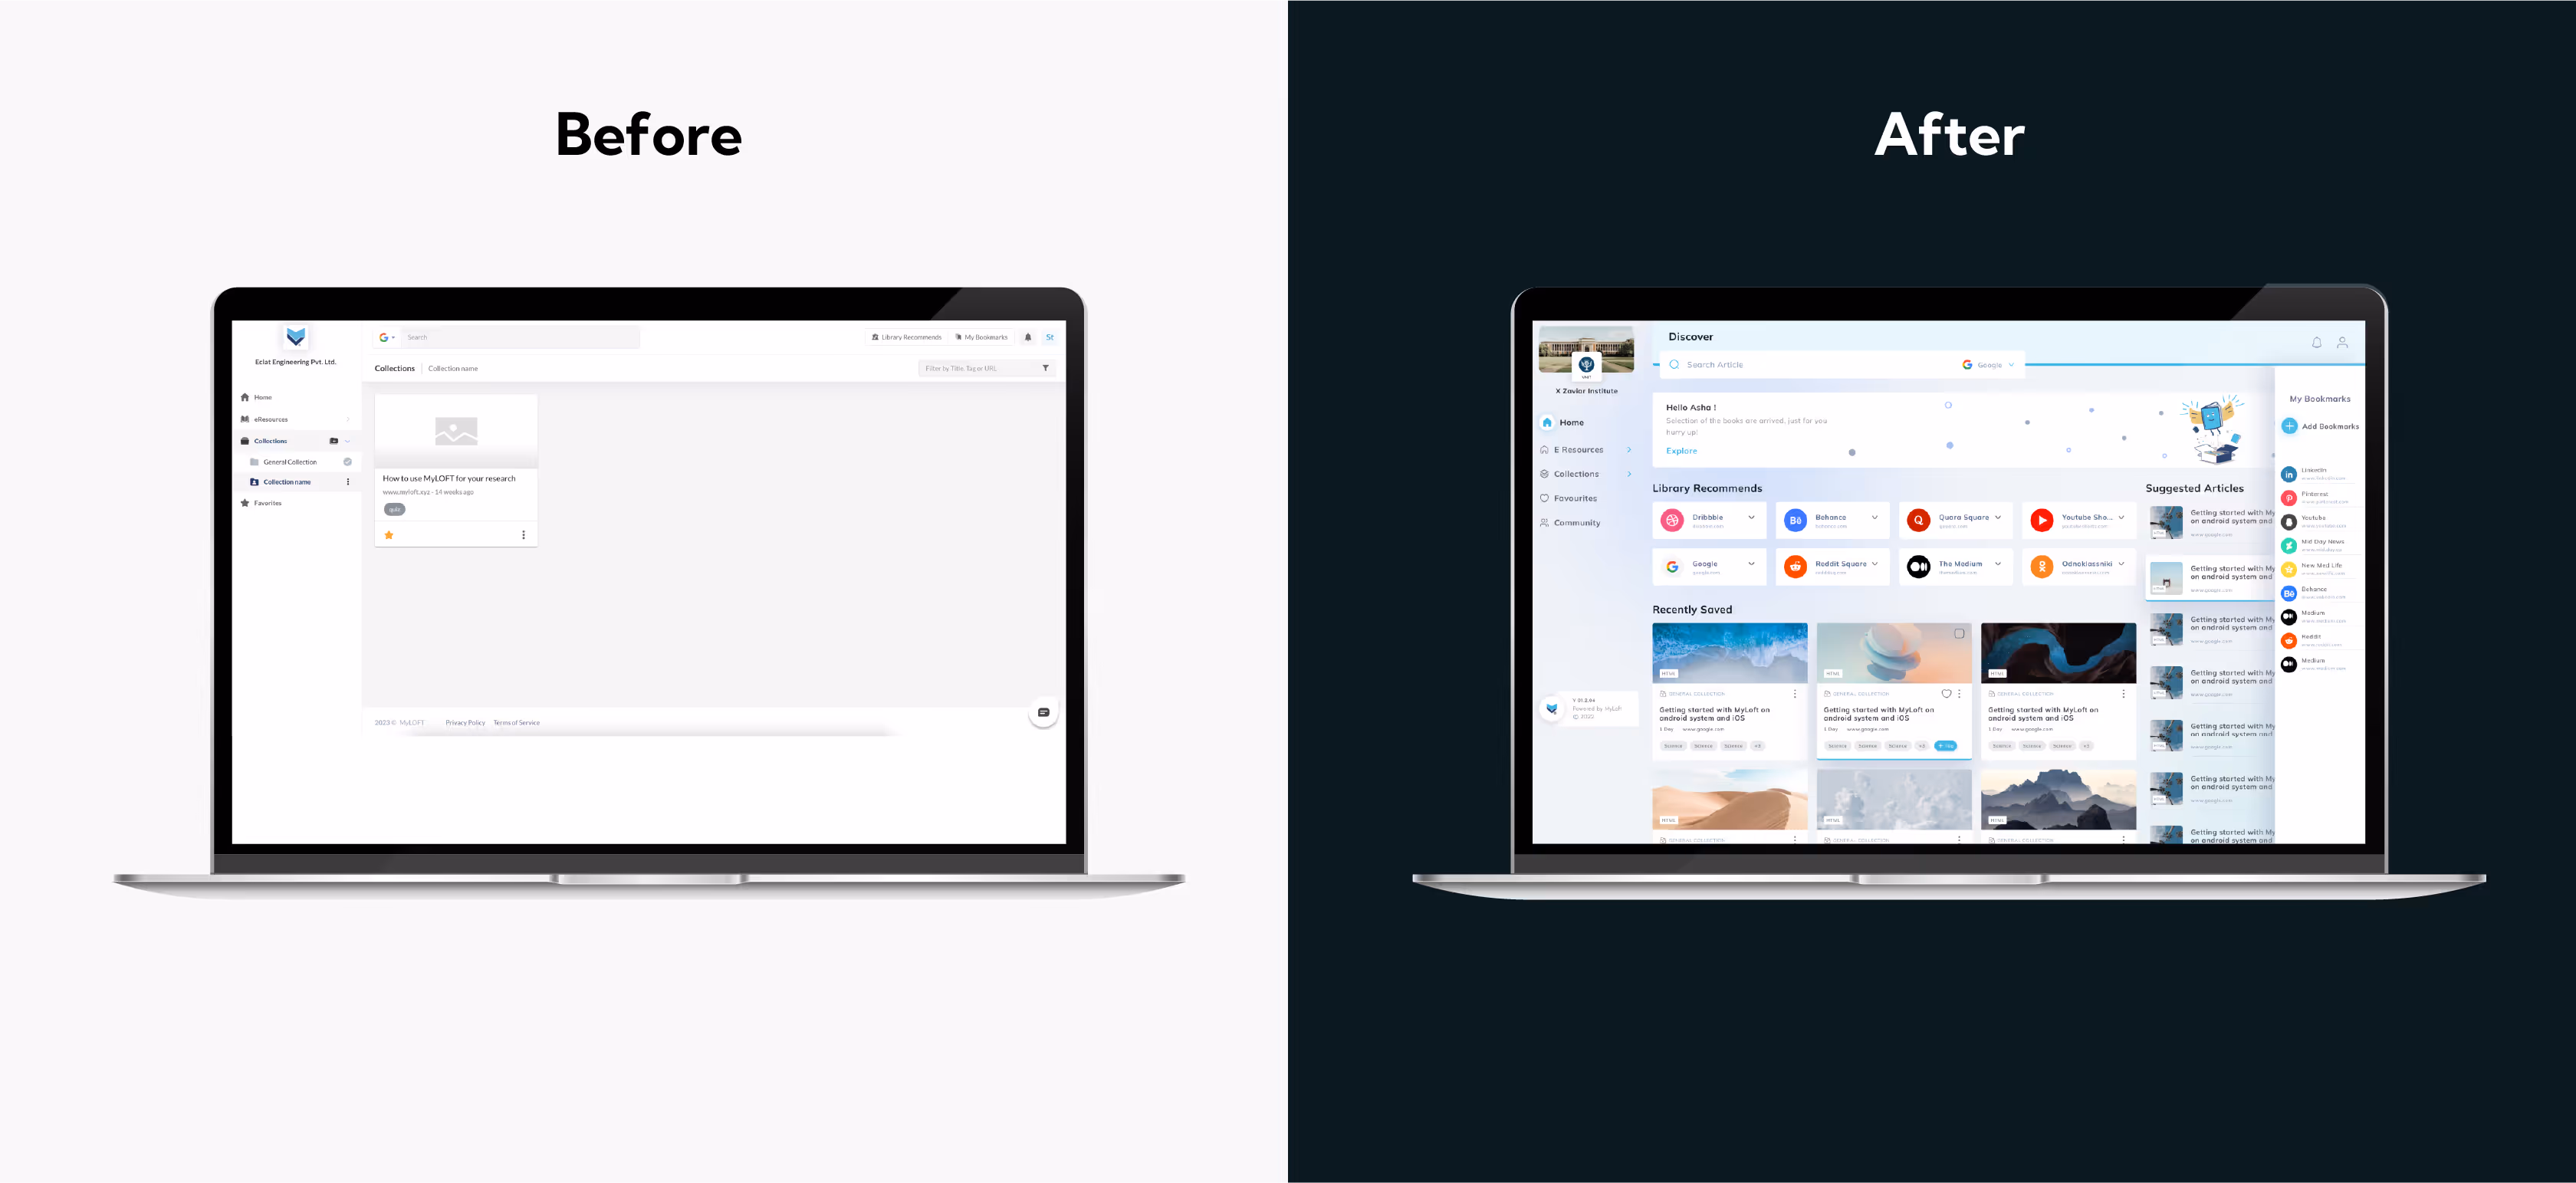
The collection of resources available should display vastness to attract users. The older version of the dashboard did not reflect the ample resources My Loft had.
Yellow Slice Touch:
- Our team of designers created a dashboard that included features like filters, a sort funnel, alphabetical searching for articles or books, bookmarks, and a search bar to search for an article in the repository.
These are just a few changes that helped My Loft revolutionize their application and web plugin for a more streamlined user experience with attractive colors and design elements.
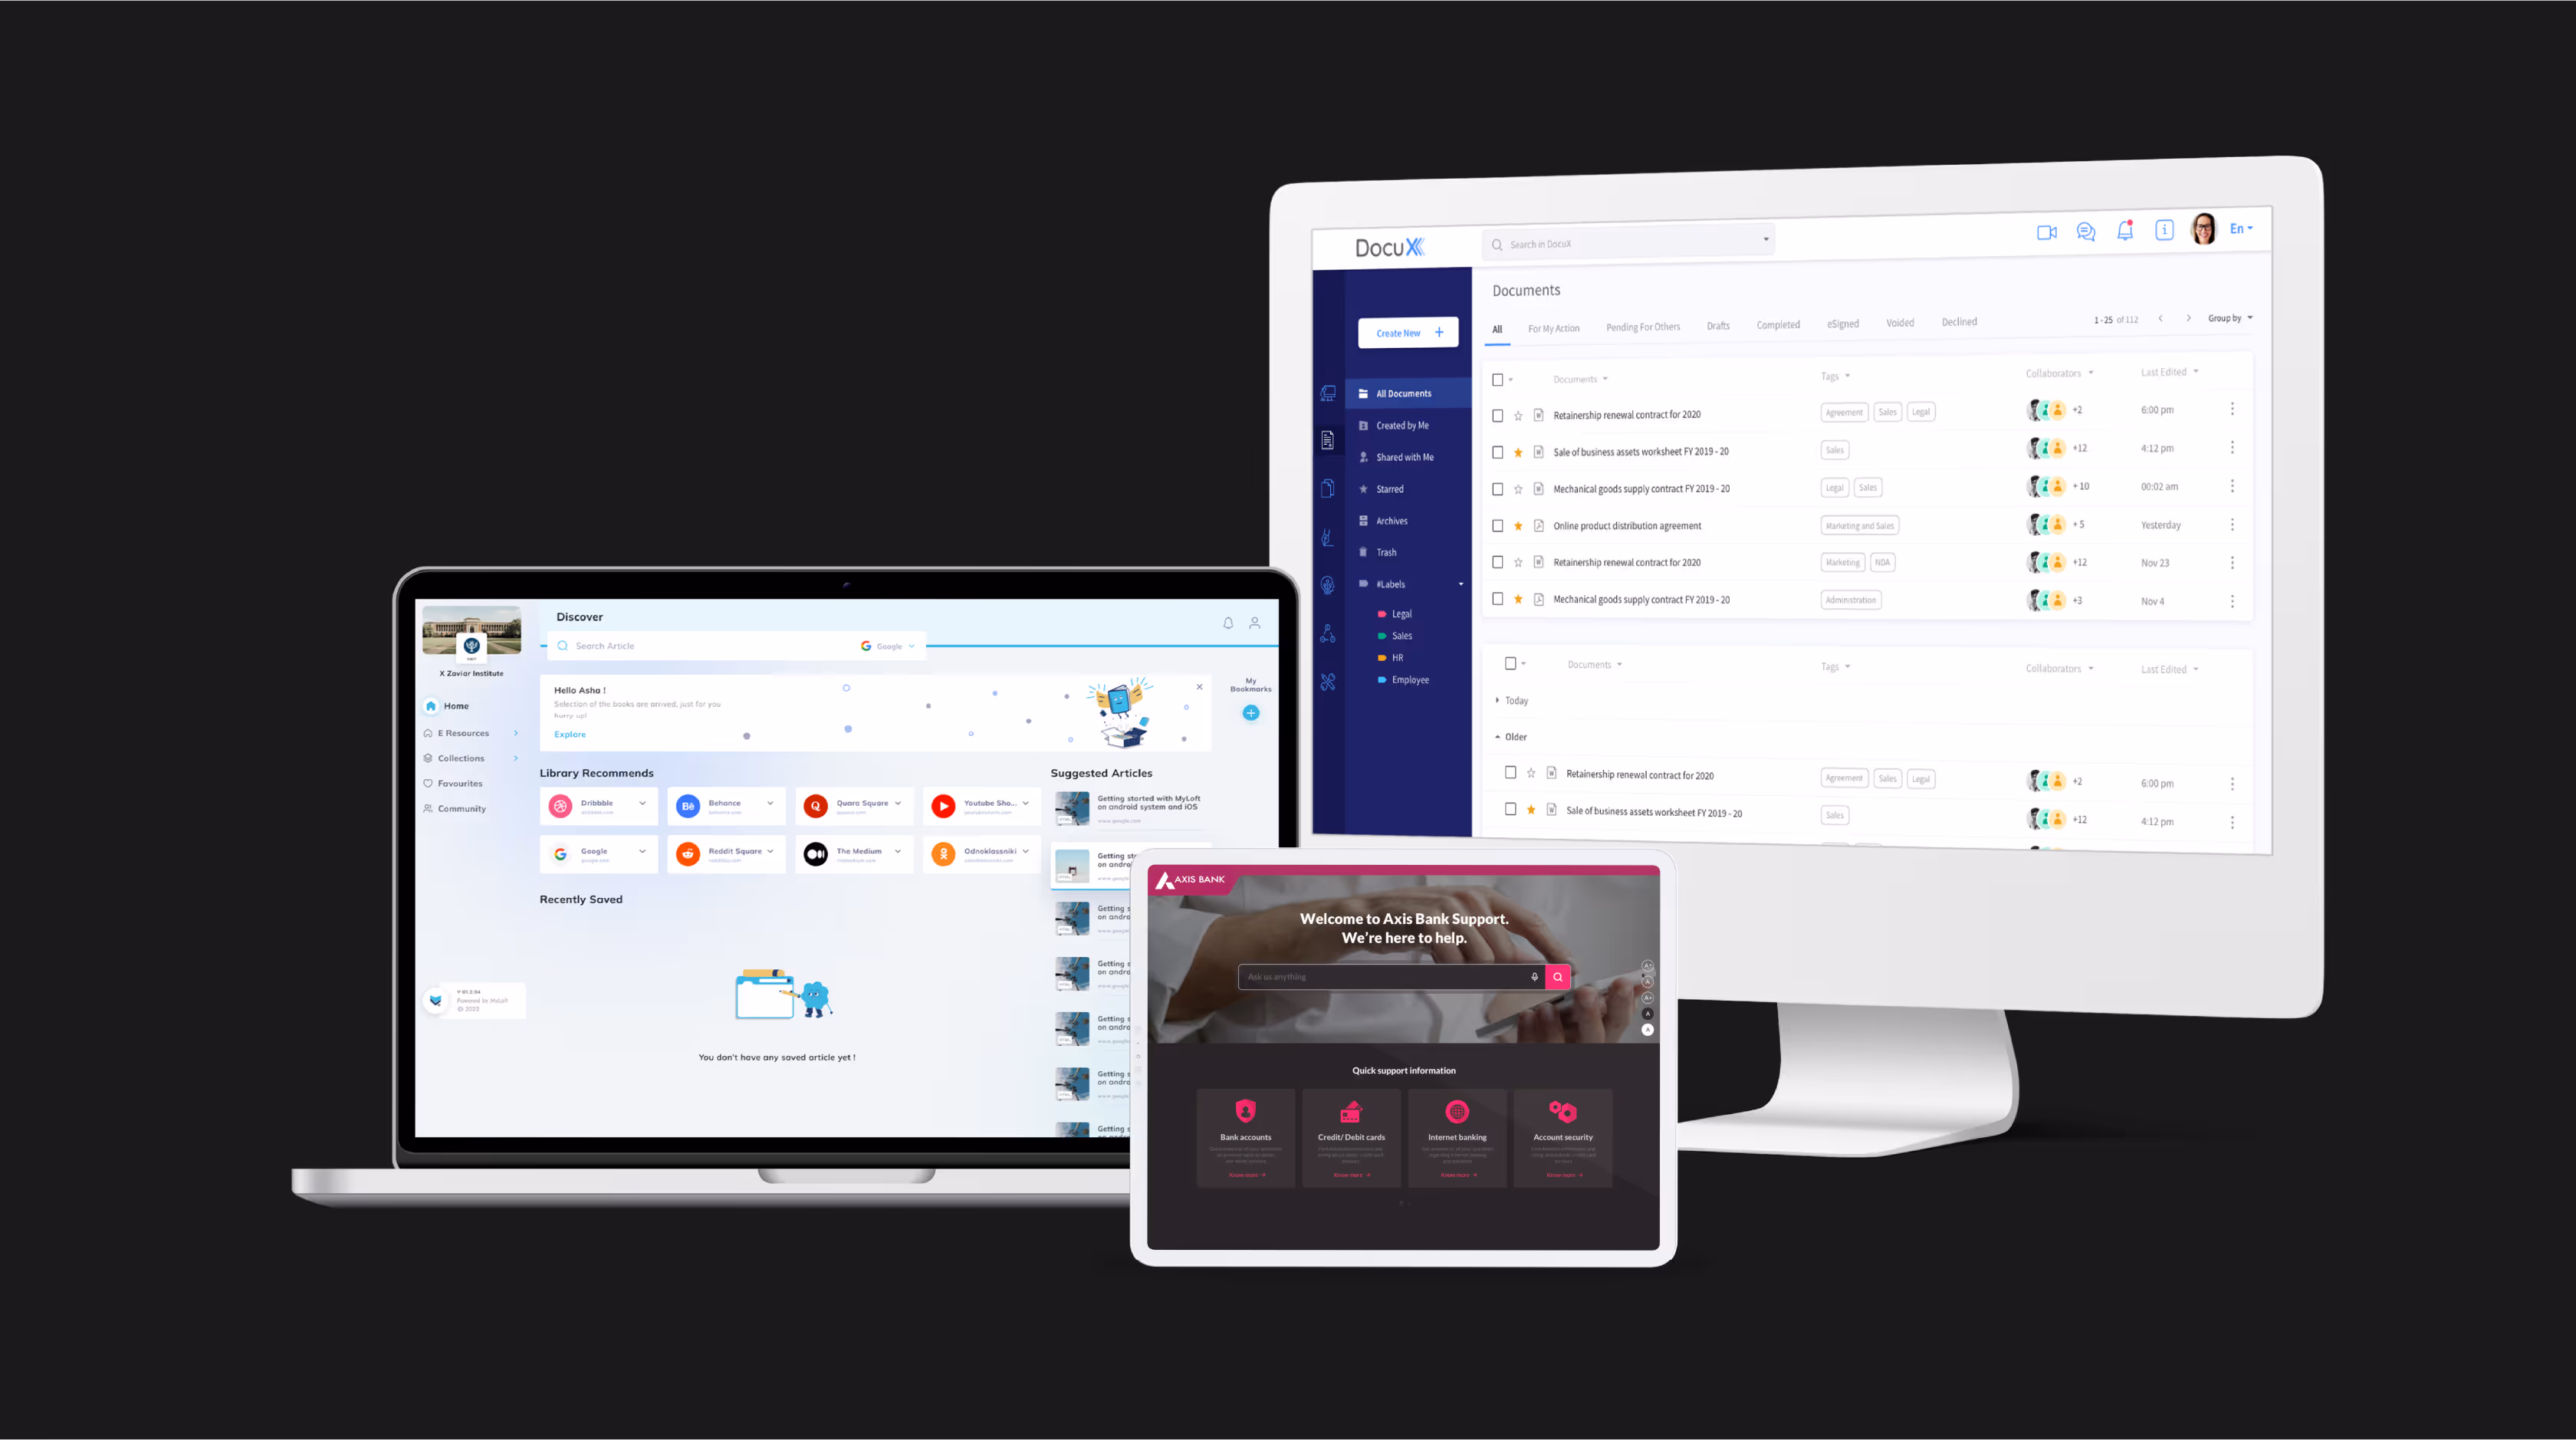
2. DocuX
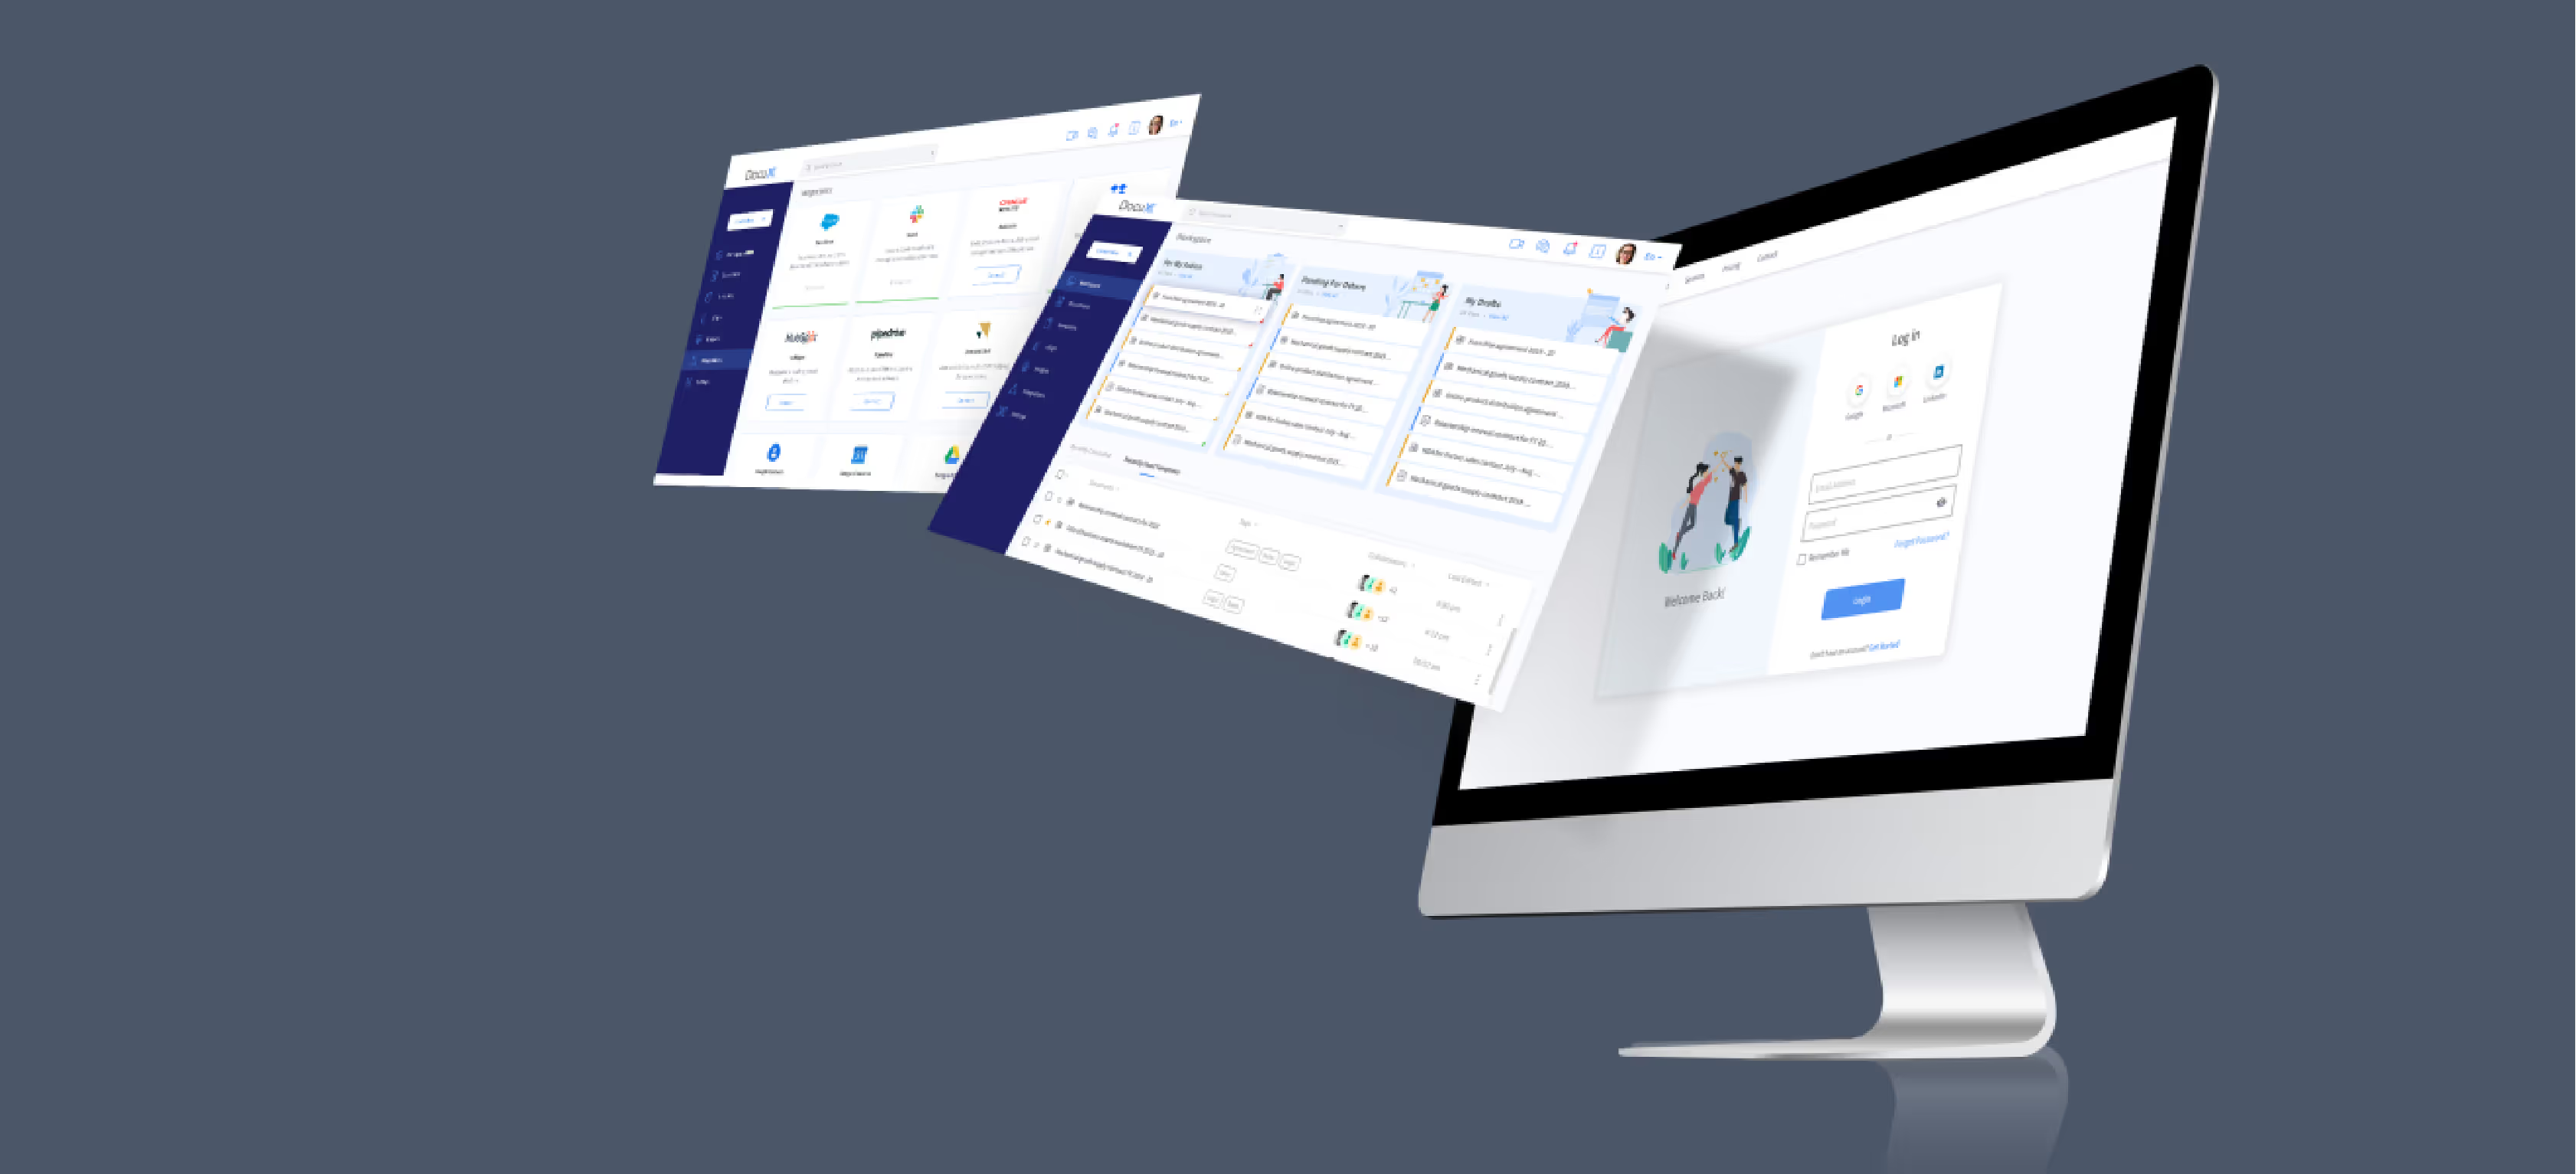
DocuX is a software-as-a-service platform that offers people and businesses that deal with documentation on a regular basis a complete solution for document management. Without affecting the quality of the task at hand, the platform cuts down on the amount of manual paperwork and the time needed to complete tasks.
Problem Statement
To put together an intuitive user experience with a full lifecycle system that facilitates the creation, sharing, and execution of official documents by users.
Key Takeaways from Docuxs Dashboard
Let us take you through the interactive designs our team created for more streamlined documentation.
Yellow Slice Touch:
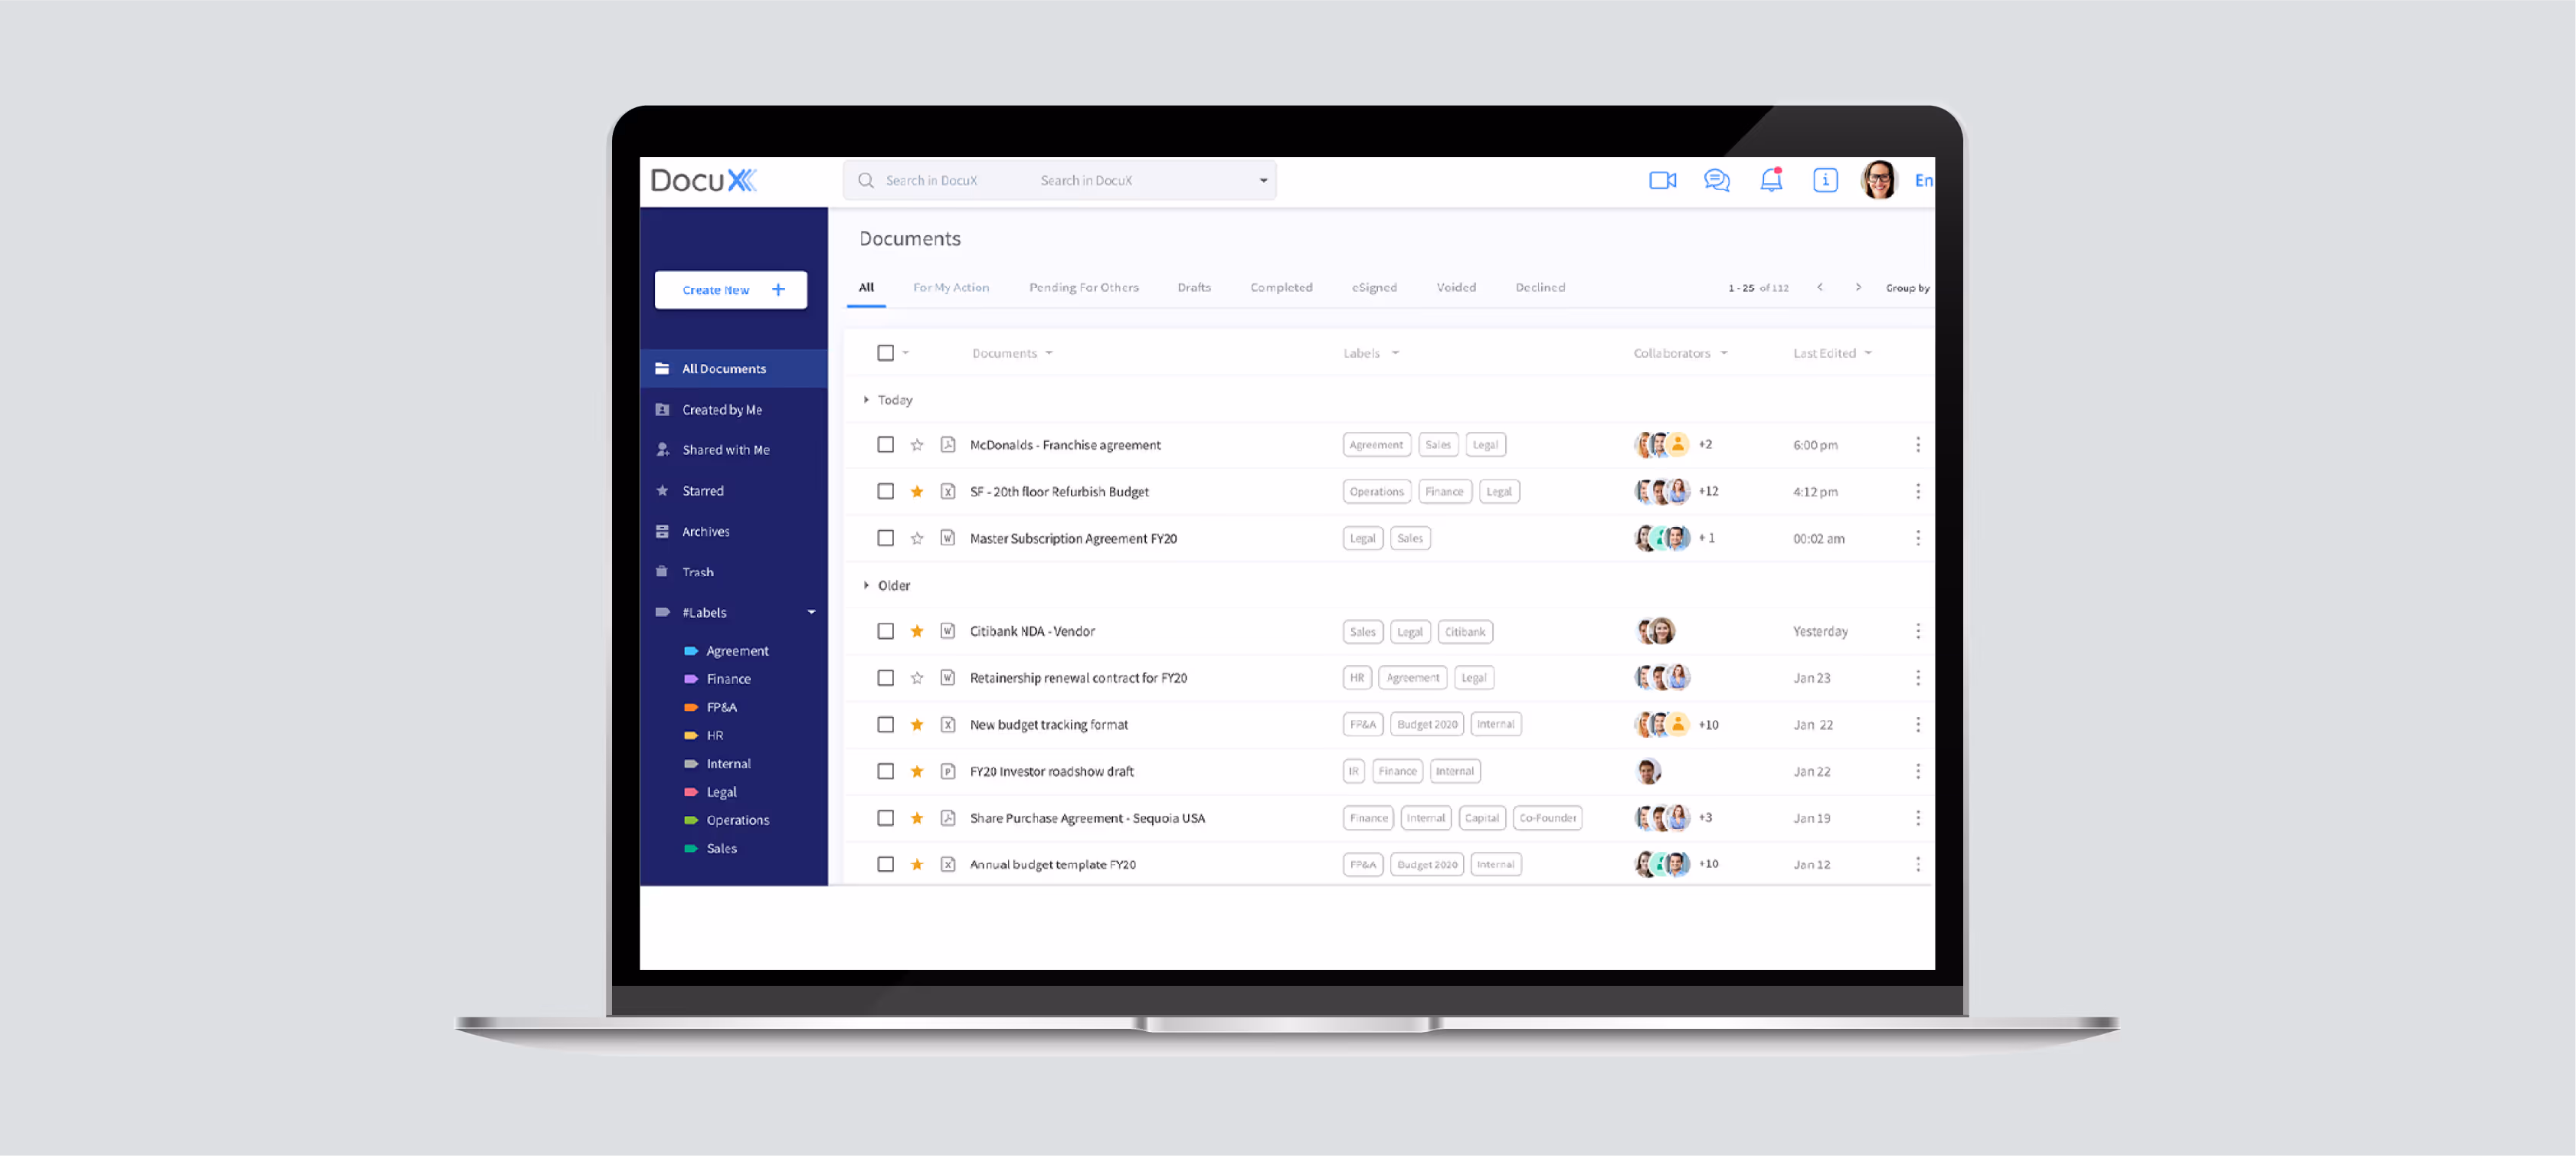
- Every user has their own dashboard with the complete list of documents they are associated with and the details of the other company executives who are part of the deal.
- On the left-hand side of the dashboard, we have provided functionalities such as creating a new document, folders with documents you created and the ones shared with you, archives, and labels for different categories of documents.
- The dashboard also includes a notification tab along with messaging and video chat options on the upper side of the design.
- We added three sections that divide the users documents into for my actions, pending for others, and my drafts. The names clearly define the arrangement of the documents on this page.
- As you can see in the bottom left corner, we have also added an activity reader that motivates the users by telling them how many tasks they have completed in the day.
- A simple yet powerful design to help users connect to the multitude of integrations provided by DocuX. Users can connect with their clients on any platform they need within the dashboard itself.
Documenting could have never ever been easier with DocuXs idea, and the innovation and transformation it needed were sprinkled by Yellow Slice vanishing away all their roadblocks.
3. Axis Bank

It is Indias third largest private sector bank, with a large retail footprint of more than 4000 branches and 10,000+ ATMs across the country. The bank provides credit services to both private citizens and small companies. It also offers card services, Internet banking, ATM services, depository services, insurance products, and services for non-resident Indians (NRIs). The Bank provides the full range of financial services to its clientele, which includes retail businesses, MSMEs, large and mid-sized corporations, and agricultural companies.
Problem Statement
As one of the leading private banks in India, Axis Bank wanted its users to have a smooth user experience while using its services through mobile app or online banking portal. They wanted to make their portal lively and interactive with an enhancement in the UI of the dashboard.
Key Takeaways from Axis Banks Dashboard
Let's take a look at how Yellow Slice transformed Axis Banks dashboard.
Yellow Slice Touch:

- We started with designing a concept design for the dashboard. We conducted a quick UX audit, understood the UI animations, icon designs, and illustrations required, and started the work.
- We divided the screen into two sections: the first part includes the balance amount left to use for further payments, and the second part includes the actions that the user can take immediately.
- The dashboard would include the amount the user spent last night, any upcoming payments, some payments coming up, the salary being credited, any funds to be debited by cheque or debit card and transaction history.
- The bottom of the dashboard includes accessible icons for the homepage, notification center, and menu.
- After the work was all done, we delivered the final files in HTML format.
Create Magic the Yellow Slice Way!
Do you know there are several companies that are gatekeeping their ways of creating something amazing, like Coca-Cola? Secret recipes have some tricks or some extra ingredients that make them different in the market.Well, working in the UI/UX industry for years, at Yellow Slice, we have created our secret recipe for designing the perfect, user-friendly, streamlined dashboards.We are not going to gatekeep our way of creating magic with colors, icons, elements, and more to cook up your ideal dashboard.Yellow Slice's dashboard design process is straightforward and effective, focusing on key stages to ensure a user-friendly and visually appealing outcome:
SOAK: Understanding the Basics
We begin by soaking in essential information about the platform, users, and project goals.
User Personas: They create hypothetical user personas to understand the target audience better.
Storyboarding and Video Shooting: Visual representations through storyboards and videos help map out user journeys.
THINK: Ideas and Structure
With a foundation in place, we move to the thinking phase for ideation and planning.
Concept Development: Brainstorming sessions lead to the development of design concepts.
Visual Mood Boards: A visual guide is created through mood boards, setting the tone for colors, typography, and imagery.
Website Sitemap: A logical structure is outlined for web dashboards to ensure easy navigation.
EXECUTE: Bringing Ideas to Life
The rubber meets the road as our designers translate ideas into tangible designs.
Responsive Design: Dashboards are designed to adapt to various devices and screen sizes seamlessly.
Color and Typography: A carefully chosen color palette and typography contribute to a visually cohesive design.
UI Screens and Elements: Intuitive user interfaces are crafted, incorporating buttons, icons, and interactive features.
Testing: Rigorous testing ensures a smooth user experience and addresses potential issues.
PROOF: Results and Refinement
Yellow Slice concludes by evaluating the results and making necessary refinements.
User Testing: Feedback is collected through testing, ensuring the dashboard meets user expectations.
Performance Analytics: Data-driven insights help measure the effectiveness of the design.
Our dashboard design process is a simple yet comprehensive journey from understanding the basics to bringing ideas to life and refining them based on results.The emphasis on user personas, visual guidance, and responsive design ensures that the final dashboard presents data effectively and is user-centric and visually appealing.
What Principles to Follow for Dashboard Design in 2024?
Everyone loves to follow trends, so why should UI/UX designers stay back? If you are an active social media user, you must know the 2024 trends of different industries. As a design agency, we will guide you through the dashboard design principles, which will bring out the best in your dashboards this year.
Start with users, not the data
Understand user personas, their roles, and specific needs. Conduct interviews or surveys to gather insights about their priorities, tasks, and the information they seek. Tailor the dashboard to cater to different user groups, ensuring each finds relevant and actionable data.
Choosing the right data visualization
Different data visualizations serve distinct purposes. Use bar charts for comparisons, line graphs for trends, and pie charts for proportions. Ensure the chosen visualizations align with the nature of the data and aid quick comprehension without misleading interpretations.
It is a storytelling process
Design the dashboard with a logical flow that guides users through a narrative. Start with high-level summaries and progressively drill down to more granular details, enabling users to explore data deeper while maintaining context.
Provide immediate access to relevant info
Highlight critical metrics prominently, using larger fonts or eye-catching colors. Utilize well-designed dashboards that allow users to spot important data points immediately without unnecessary scrolling or searching.
Logical layout
Employ a layout strategy similar to news articles prioritize information from most to least important. Arrange content in a way that captures attention with essential data at the top, providing a clear direction for users to follow.
Minimalism
Less Is More. Embrace simplicity in design by removing redundant elements or overly detailed data. Focus on presenting key metrics and KPIs concisely, avoiding distractions that might dilute the dashboard's message.
Round your numbers
Simplify numerical data without losing context. Round figures or use abbreviations when possible to prevent overwhelming users with excessive precision, allowing quicker comprehension.
Use size and position to make priorities clear
Employ visual cues such as larger font sizes or prominent placement to highlight critical information. This draws attention to key insights, guiding users' focus toward actionable data points.
Have a clean, uncluttered dashboard
Maintain a clean interface by organizing elements logically, using consistent color schemes and fonts, and removing unnecessary decorations. Ensure a clear visual hierarchy that guides users through the dashboard effortlessly.
Bring Your Dashboards to Life with Yellow Slice!
The significance of dashboard design lies in its ability to transform complex data into digestible visuals, empowering swift decision-making.At Yellow Slice, we promise you the ultimate Dashboard Design solutions. By offering at-a-glance insights, enhancing user experience, and supporting data-driven strategies, our well-designed dashboards serve as essential tools for your organizational growth. Their adaptability through customization, role-based views, and collaborative features fosters efficient communication.Still thinking? Its time to leverage the power of an effective dashboard design not only to streamline operations but also to fuel informed decision-making!
FAQs
Q1. Why is dashboard design important for businesses?
Dashboard design is crucial as it visually represents complex data sets in a concise, understandable manner. It aids in quick decision-making by providing at-a-glance insights, facilitating data-driven strategies, and enhancing user experience.
Q2. What key elements should a well-designed dashboard include?
A well-designed dashboard should feature prominent metrics and KPIs, intuitive data visualizations, customizable elements, logical layouts, and user-centric design tailored to meet specific user needs.
Q3. How can I ensure my dashboard effectively communicates insights?
To ensure effective communication, focus on simplicity, relevant data selection, clear visualization techniques, storytelling through data, and organizing information in a logical sequence that aligns with users' needs.
Q4. What are the common mistakes to avoid in dashboard design?
Common mistakes include information overload, inappropriate data visualizations, lack of user-centered design, cluttered interfaces, and failure to consider users' priorities and workflows.
Q5. How can I ensure my dashboard design stays relevant over time?
To maintain relevance, regularly review and update dashboard components based on changing user requirements, evolving data trends, technological advancements, and feedback from stakeholders.
Q6. What tools or software are recommended for creating effective dashboards?
Several tools like Tableau, Power BI, Google Data Studio, and Excel offer dashboard creation capabilities. Choose based on your organization's requirements, data sources, ease of use, and scalability.
Q7. How can I measure the success of a dashboard design?
Success metrics for dashboard design include user adoption rates, user feedback, data accessibility, decision-making efficiency, the accuracy of insights derived, and the impact on business goals and strategies.


Let's create something amazing!
Let's discuss your vision and how we can bring it to life with impactful design solutions.
.avif)
Good design starts with Sliced Newsletter
Subscribe to the Sliced newsletter and get the best of research, UX writing, product psychology, CX, and design systems, right in your inbox.
